Daniel Eduardo Muñiz
daniel.muniz.arg@gmail.com
Full Code Assignment N° 1 HERE: Segmenting and Clustering Neighborhoods in Toronto
The Battle of the Neighborhoods
Created with IBM Watson Studio
Project for the Coursera’s IBM Applied Data Science Capstone Course
Predicting Land Prices in Buenos Aires, Argentina
1. Introduction and Discussion of the Business Objective and Problem
The Task At Hand
A Real Estate Agent, with a substantial e-commerce expertise in temporary apartments rent management, decided to diversify his business operations opening a new business branch of land sales to investors to build studio apartments. As a part of his strategy he has decided to be more informed and selective, and take the time to do some market research. I’ve been given the task of assisting him to make data-driven decision. This will be a major part of his decision-making process, the other being focused on the ground qualitative analysis. Since the temporary apartment rental market in Buenos Aires is expanding greatly, real estate investors seek to invest in building housing units that maximize their utility, the studio apartments. This project is a part of a full data science and machine learning studio using other techniques, such as clustering, classification and recommendation systems. As requested, the main goals in this step of the project are:
- Identify the most expensive neighborhoods through data analysis and visualization tools.
- Build a regression model for predicting land prices in Buenos Aires.
- Improve our model by adding data through the Foursquare API, defining a function to search number of venues near a piece of land.
2. The Data Science Workflow
The Data Science Workflow for this project includes the following:
• Outline the initial data that is required:
To develop the project we need data regarding the neighborhoods in Buenos Aires, the surface in square meters and land prices per square meters in USD. We require to research the data and to identifify a suitable useable source. If it is found but is not in a useable form, data wrangling and cleaning will have to be performed. The Foursquare data to build the multi-linear regression model exploring the number of venues near a piece of land is readily available.
• Obtain and Explore the Data:
Research and find suitable sources. Access and explore the data to determine if it can be manipulated for our purposes.
• Initial Data Wrangling and Cleaning:
Clean the data and convert to a useable form as a dataframe.
• Visualization:
Analysis and plotting visualizations. Data visualization using various mapping libraries.
• Data Analysis and Location Data:
Develop a simple linear model to predict the land prices. Foursquare location data will be leveraged to explore the total number of venues near a piece of land to improve our model. Build a multi-linear regression model.
• Discussion and Conclusions:
Recomendations and results based on the data analysis. Discussion of any limitations and how the results can be used, and any conclusions that can be drawn.
3. Obtaining and Exploring the Data
After researching on the internet I found that this project can be developed using open data provided by the Goverment of the City of Buenos Aires. If you are interested in researching, you could find all the datasets regarding the City of Buenos Aires in this link:
For this this project I will use the following datasets:
Neighborhoods of Buenos Aires (GeoJSON)
Analizing the Land prices dataset we obtain information about m2total (total square meters), barrio (neighborhood) and preciousdm (price per square meter in USD).
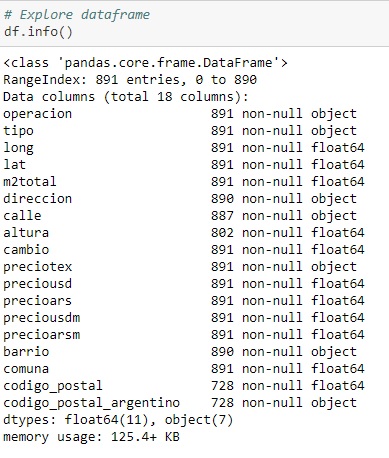
4. Initial Data Wrangling and Cleaning
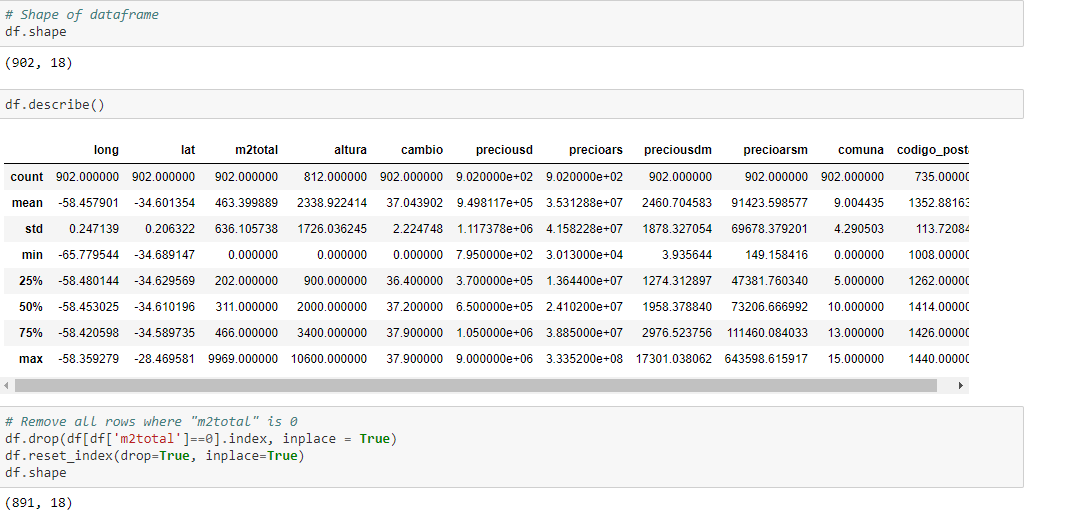
Analyzing the descriptive statistics of the data i found that there are some rows where the m2total fields is 0, so i decided to drop that rows. There are neither NANs nor null values.
5. Visualization
# Find average price per square meter per neighborhood
mean_by_neighborhood = df.groupby('barrio').mean()[['preciousdm']]
mean_by_neighborhood.rename(columns={'preciousdm': 'mean_m2_usd'}, inplace=True)
mean_by_neighborhood.reset_index(inplace=True)
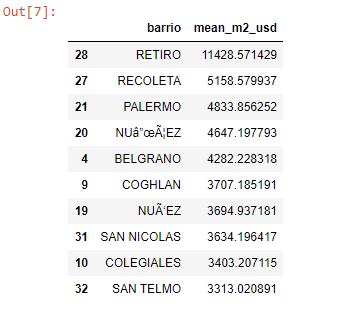
# The 10 most expensive neighborhoods.
mean_by_neighborhood.sort_values(by='mean_m2_usd', ascending=False).head(10)
The code above shows the 10 most expensive neighborhoods in Buenos Aires:
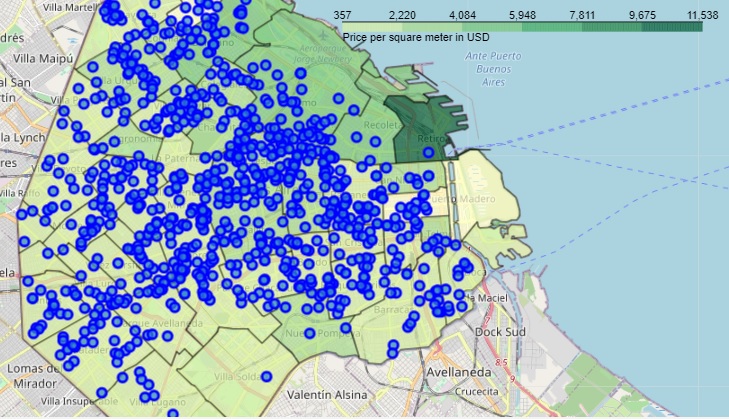
A Choropleth map is a great tool to visualize the land prices per neighborhood (Full map HERE):
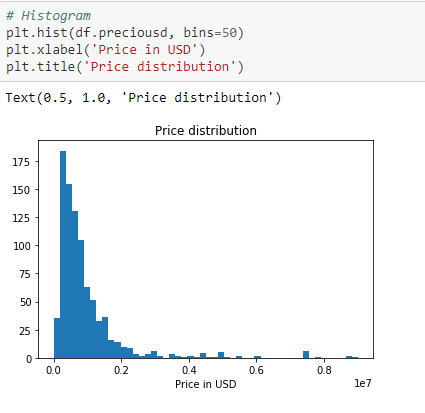
Let’s see how data is distributed:
6. Data Analysis and Location Data
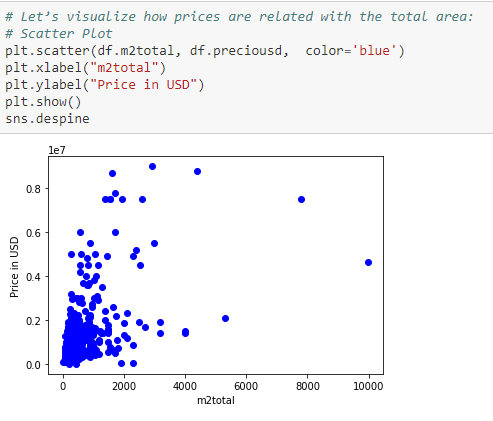
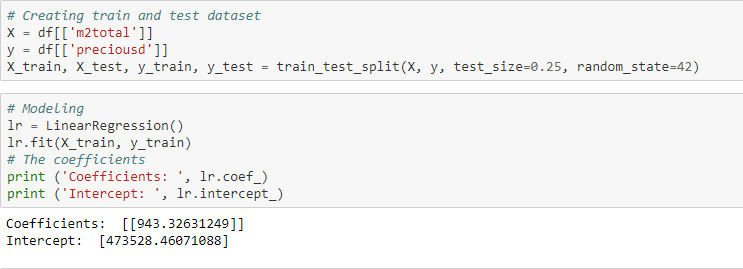
There is a strong positive linear correlation of 0.54 between the total square meters of the land and its price. Using that variable we can design a simple linear regression model to predict the price of the land.
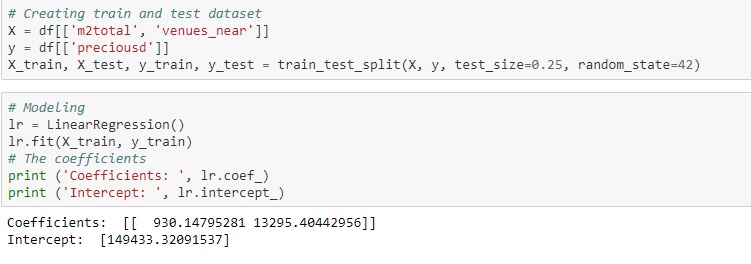
Exploring the total venues near a piece of land using Foursquare API i could design a multi-linear regression model to predict the price of a land in Buenos Aires:
7. Discussion and Conclusions
The objectives outlined in this phase of the project could be met, which can be verified in its development. The tools and models designed provide a solution to the defined business problem. Since this project is developed in stages, I can detect a possible improvement to it for future work, which would be to identify how the types of nearby venues affect the value of the land, to give greater precision to the model.